
Analytics for Smarter Traffic Safety Decisions
Turn Traffic Data into Actionable Insight
Every citation and collision report contains valuable information. The challenge is turning that information into a clear understanding of where crashes occur, why they happen, and where enforcement efforts can have the greatest impact.
Crossroads traffic analytics software transforms collision and citation data into insights that help law enforcement agencies identify trends, monitor traffic safety, and inform enforcement planning. Built specifically for public safety, the system combines powerful queries, visual reporting, and location-based analysis to help agencies understand what's happening across their road network.
Whether reviewing a single intersection or analyzing traffic activity across an entire jurisdiction, Crossroads helps agencies move beyond collecting data to understanding it.

Identify High-Risk Locations with Confidence
Traffic safety starts with knowing where problems occur.
Crossroads uses Street Modeling technology to organize collision and citation data by street, intersection, and mid-block locations, making it easier to identify high-incidence areas and recurring traffic safety concerns.
Agencies can rank locations, compare collision activity, and examine enforcement trends using accurate location-based searches rather than manually reviewing individual reports.
Integrated GIS mapping and Google Earth visualizations provide another way to explore traffic patterns, helping agencies clearly see where collisions occur and where enforcement or engineering improvements may be needed.
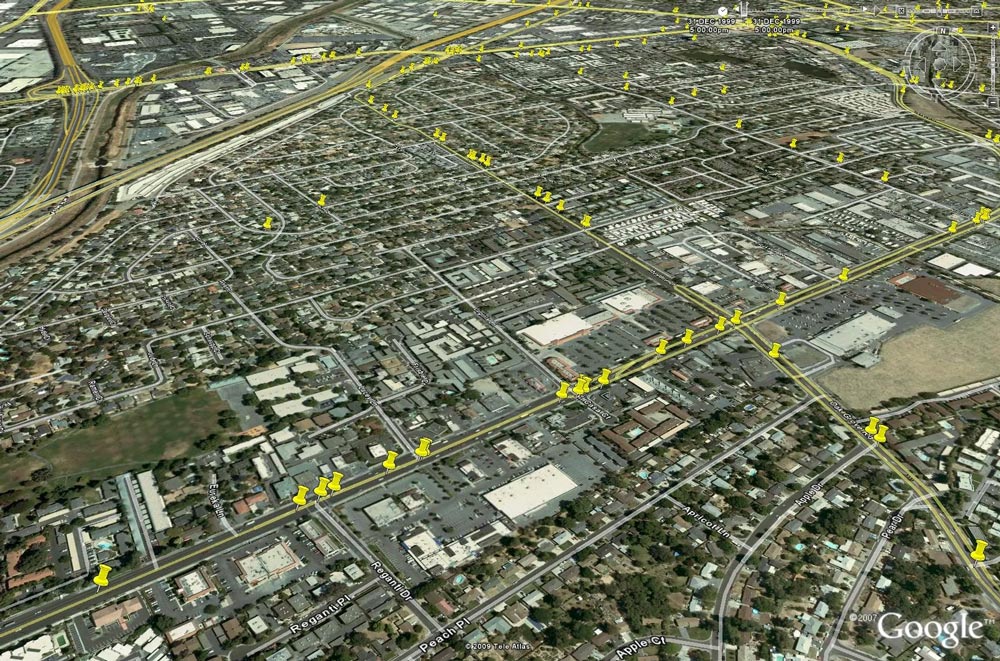
Explore Traffic Trends from Every Angle
Support Traffic Safety Planning
Effective traffic enforcement requires understanding long-term patterns and directing resources where they can have the greatest impact.
Crossroads collision analytics helps agencies evaluate traffic activity over time, compare enforcement efforts with collision trends, and identify locations that may benefit from targeted enforcement, engineering improvements, or public education initiatives.
Because the system analyzes both citation and collision information, agencies gain a more complete picture of traffic safety across their communities.

Connected to Your Traffic Reporting Workflow
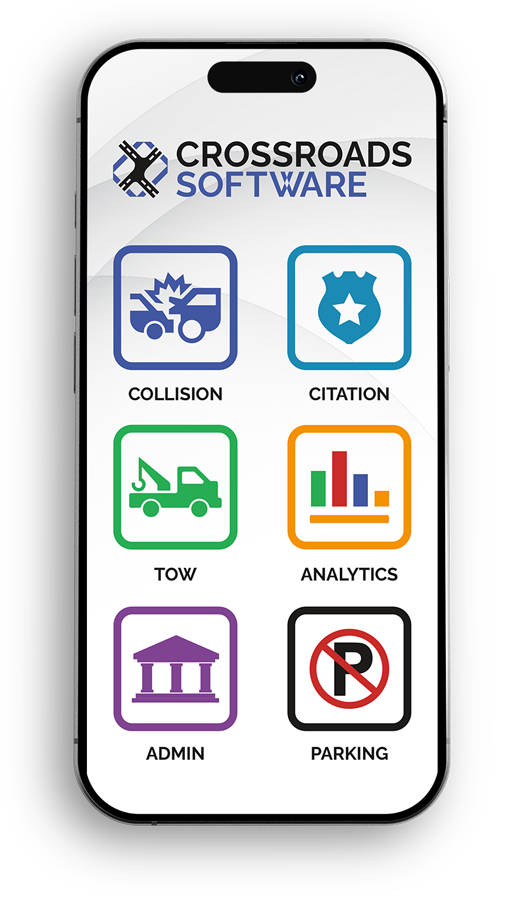
Crossroads Analytics works alongside the Mobile Traffic Suite and the Traffic Suite, allowing agencies to analyze the information they already collect through their everyday reporting processes.
Data from Electronic Citations, Electronic Collision, and other Crossroads applications can be used to generate queries, reports, and charts without duplicate data entry. Agencies can also import and export information in various formats, enabling connected workflows across existing reporting systems.
See the Bigger Picture Behind Every Report
Individual reports explain what happened. Analytics helps explain where, when, and how often those events occur across your community.
By combining location-based analysis, visual reporting, and detailed traffic data, Crossroads traffic data analytics software helps agencies identify emerging trends, prioritize enforcement activities, and support long-term traffic safety planning with greater confidence.